Recently I've been playing with colours and I'm going to do a quick two part guide on how to change colours quickly and easily in your Qlikview docs. Starting right from scratch today and moving onto best practices in the next post.
Part 1 (Basic)
1. Changing colours on a chart2. Applying colour defaults
3. Quickly change colours
Part 2 (Intermediate)
1. Defining colours with variables2. Defining colours within the load script
3. User Defined Colours with triggers
Now let's get cracking, first you'll need to download my latest Qlikview so that you can follow along with the steps.
1. Changing colours on a chart
Hopefully, the document should look like this.Four charts showing the same data in a few different views in the standard Qlikview colours
Now to change the colours of a chart
- Right click the "Month on Month Comparison" chart and select "Properties"
- Select the "Colours" Tab
- Select the first colour by clicking the coloured box and you will see the below options
- For ease, let's change the chart using fixed colours, click on the coloured box and select a new colour from the palette. I've picked a slightly darker blue.
- Hit OK and apply until you get back to the document and you will see that the first chart now has a different colour on its dimensions.
And that's how to change a colour on a single chart, now if only every chart we made from now on had the same colour selected.
2. Applying Colour Defaults
 So our document now looks like this, now let's set up our report to automatically give this colour to all new charts.
 Otherwise we will have to manually set the first colour every time.
- As in step 1, right click the "Month on Month Comparison" chart, select "Properties", then navigate to the "Colors" tab.
- Then select the "Advanced" button
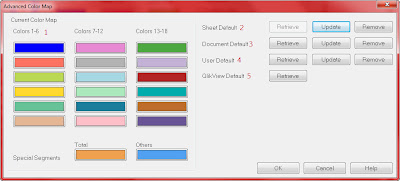
- This opens the "Advanced Color Map" as below. This allows you to
 |
| 1. Define the Colour List applied to the current chart (as in step 1) 2-4. Maintain Default Colours at Sheet/Document/User level 5. Retrieve Qlikview's default colours |
- Click the "Update" button, next to "Sheet Default".
- This takes the colours from the current chart (including our amended colour) and makes it the default colours for any new items created on this sheet.
- Click OK until you get back to the current sheet, you should see no difference yet...
- Now right click and create a new chart.
- Click Next until you get to the "Color" tab, here we can see that our new colour scheme has been applied as default.
Easy as that, now let's make the rest of those pesky charts the same colour quickly.
3. Quickly Change Colours
So, we now know how to change colours on a chart and set the default for new charts for a sheet, document or for all documents we create.Now say you have finished your Qlikview document with lots of charts and then the colour scheme changes... Now you need to go through and manually change every single chart, here's a tip that might save you some time in the future
- Right Click the chart "Month Figures - Dog", select "Properties", "Colors" and click on the "Advanced" button (as in Step 2)
- Now instead of updating the "Sheet Default", we want to retrieve it, so click the "Retrieve Button"
- and that's it done. Click ok and your second chart now matches the first.
Join me next time for some more time saving tips on applying colours to your documents.
Links
- Qlikview Document - Painting with Colours (Google Drive)


No comments:
Post a Comment