So from my previous post, we know how to get data from an SQL database into our Qlikview document.
Today I'm going to cover how to quickly check that your data has made it into Qlikview in the state you wanted it in..
Again this comes with the disclaimer of this is how I use Qlikview, if you can see obvious holes in my logic please feel free to point them out.
I think Qliktech suggests that you add a list box and check the values, however for checking data I use a Multi Box.
So, after clicking load and you are returned to your screen,
 1. Right click on your blank sheet, select "New Sheet Object" > "Multi Box"
2. Click Add All and give the box a title, then click ok
For those of you unfamiliar with Multi boxes, they are a collection of list boxes
 3. A Multi Box is then added to your sheet, here you can see an example of a broken one.
The field is greyed out, meaning that there are no available values for the field - Back to the script!
 |
| The field "Date" was stored as a string and so had to be converted using Date# |

After fixing any issues, your multibox is good to go! They're good for checking high level information, like "are all Claim Years included?"
High Level detail is good, although we need to check that our data makes sense when put together. There are two ways to do this, using a "Table Box" or a type of chart called a "Straight Table" - I'll go through how to create both now and then go through the benefits of using each.

4. The Table Box, right click on your sheet and click "New Sheet Object" > "Table Box"
Give the table a name, and click add all.
#Protip: Use the Promote/Demote to arrange the fields sensibly

 |
| And it looks just like Excel! |

5. Now to create a Straight Table, right click on the sheet again and this time "New Sheet Object" > "Chart"
Give your straight table a name, and select the highlighted chart type.
Then click next.
As a straight table is a type of chart, we need to set Dimensions and Expressions.
 An expression is what we're looking to measure, in this case it's "claim amount" or the money spent Per Claim.
 A Dimension is what we are measuring the expression by, so in this instance we need to define what Per Claim means, in this case, I'm including everything and then can remove what I don't need later.
Then click Next to be taken to the Expressions tab...
More code! But fear not, you still don't need to know anything more complicated then what you're trying to accomplish.
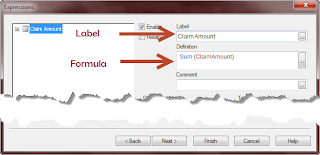
I want to know the total ClaimAmount per claim, so I select sum from the aggregation and ClaimAmount in the field and click paste. Qlikview generates your code for you! If you want to have a go at writing your own code feel free, you can always revert to using the generated code if it all goes wrong.
And that's it, click ok and you will be taken back to chart creator, give your expression a label so you can identify it and click finish.
Table Boxes vs Straight Tables
Then click Next to be taken to the Expressions tab...
More code! But fear not, you still don't need to know anything more complicated then what you're trying to accomplish.
 |
| Just select the function, the field, click paste and ok! |

I want to know the total ClaimAmount per claim, so I select sum from the aggregation and ClaimAmount in the field and click paste. Qlikview generates your code for you! If you want to have a go at writing your own code feel free, you can always revert to using the generated code if it all goes wrong.
And that's it, click ok and you will be taken back to chart creator, give your expression a label so you can identify it and click finish.
 |
| The table I created before and the straight table beneath it |
Table Boxes vs Straight Tables
Table Boxes are great for breakdowns, they can give you a breakdown of information very quickly. As they don't do any calculations, they are much lighter on the processing side. However this is a two edged sword as you can't do sums in a table, you can't group data for summaries or have totals.
Straight Tables are good for checking your data as well, allowing you to quickly summarize datasets. However, Straight Tables must contain a dimension and an expression so they are heavier on processing and you need to work out what you will be aggregating.
In essence, if you're looking to break up your data for quick summaries and investigation use a Straight Table - if you want to look into the individual details of your dataset use a Table Box.
Straight Tables are good for checking your data as well, allowing you to quickly summarize datasets. However, Straight Tables must contain a dimension and an expression so they are heavier on processing and you need to work out what you will be aggregating.
Protip: On straight tables, the scroll bar only appears for expressions so if you need to display a lot of dimensions, ensure the lowest levels are marked as dimensions and add your higher level dimensions as expressions without aggregation
In essence, if you're looking to break up your data for quick summaries and investigation use a Straight Table - if you want to look into the individual details of your dataset use a Table Box.
One Warning
Make sure you know what you're looking for in a breakdown, below is what happened when I removed the claim date column from both the Table Box and Straight Table and selected a single Transaction
 |
| The Table Box shows the first ClaimAmount it can find The Straight Table sums the ClaimAmount for both dates |
Next Time
I'm not sure what I'll be covering; if anyone has any preference leave me a comment or drop me a note on Twitter (Link at the bottom of the post). The options are
- More Scripting - lots of ETL, combining lots of data sources into a single table and converting into workable formats
- More Charts - I've covered the simplest of the charts in the simplest of ways in this post, I was thinking of moving onto bar charts and presenting them clearly
- Standardisation - This is a little bit of scripting, how to share code for your Qlikview library and setting up themes.
I will be moving onto more complex subjects in the future, but for the moment I'll be sticking with the basics and building from the ground up.
Follow @OneQlikToday's data all came from here
Excellent post, Chris . I always check my data as you describe. But I can suggest another check also. As you mentioned on your warning both table box and list box reflect only one records/value in the list if all fields in the record are equal. So if you need make sure that your extracted table has a unique key (in ERP database it calls primary key) you have to check how many records you have with the unique key in your extracted table.
ReplyDeleteSometimes missed or wrong primary key can lead to the incorrect data in QlikView application.
To check primary key I use Chat - Straight Tables. All fields which consist your primary key in your table I select as Dimension and wright count function as Expression (for example , count(TransNo) )
If selected dimensions consists primary key all record have to have 1 in the Expression fields (just sort this field as Descending to get all incorrect records in first lines) .